FOPLP Lithography Yield Prediction Targets Faster Process Ramps
Panel distortion complicates FOPLP overlay control. Yield prediction can help engineers compare process conditions before qualification and monitor production earlier.
Fan-out panel-level packaging (FOPLP) can place more packages on a substrate than wafer-based approaches, but its larger working area brings harder lithography problems. Pattern distortion and die shift vary across a panel, creating local overlay errors that can erode yield and make a stable production process harder to establish. Yield prediction offers engineers a way to assess process options earlier and reduce reliance on repeated physical trials.
The production pressure is rising as AI packages grow in size and incorporate more high-bandwidth memory (HBM) and high-performance chips. Manufacturers need to establish reliable process conditions and move from development to high-volume manufacturing (HVM) quickly, while protecting yield. FOPLP’s potential substrate-efficiency gains are attractive, but realizing them depends on controlling panel-level variation.
Panel area brings both capacity and variation
A study comparison illustrates the capacity difference: a 300mm wafer achieved approximately 55% substrate utilization and six packages per wafer. A 300mm panel reached 86% utilization and 12 packages per panel, while a 510 × 515mm panel reached 74% utilization and 30 packages per panel. Higher utilization and more packages per substrate can improve manufacturing efficiency and reduce cost per package.
Those figures don’t remove the process challenge. Unlike wafer-based processes, panel distortion may not follow a uniform pattern across the substrate. Local shifts and pattern errors mean that a correction effective in one area may leave another area with unacceptable overlay. Engineers must account for those spatial differences while balancing yield against throughput.
Correction strategy sets the yield and throughput balance
Global correction is fast, but it can leave localized overlay errors uncorrected. Zone correction addresses variation in smaller areas and can improve yield, though field data in the study put its yield between 40% and 80%, with reduced throughput. Die-by-die correction can raise yield further, at a substantial throughput cost. Site-by-site correction provides an intermediate option, balancing yield gains with faster processing.
There’s no single setting that suits every panel and layout. Finding a workable operating window can involve changing exposure field configurations, die and panel layouts, and overlay thresholds. Each adjustment may require another run and a fresh analysis of the results. That cycle consumes engineering time and material, extends development, and can postpone a production ramp.
Use metrology data to narrow the search
Yield prediction combines offline metrology with algorithms that estimate likely process performance. Measurements capture panel-scale variation, including pattern errors and die shifts. Engineers can then evaluate those measurements alongside process variables such as exposure field configuration, layout and overlay thresholds. The resulting estimates let teams compare candidate conditions before committing to extensive trials on production hardware.
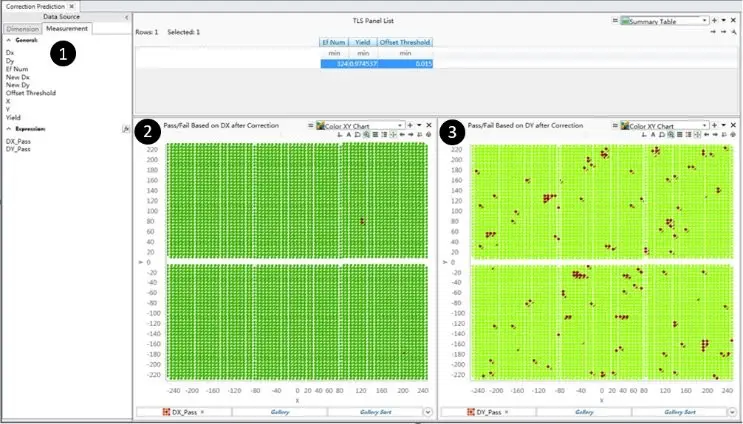
Visual analysis helps explain the predictions. Heat maps, vector plots, histograms and yield dashboards can show where errors cluster and how sensitive results are to different process settings. In the example shown below, comparing overlay maps reveals that Y-axis errors are more significant than X-axis errors and contribute directly to yield loss. That gives engineers a more specific direction for investigating the cause and choosing corrective action.
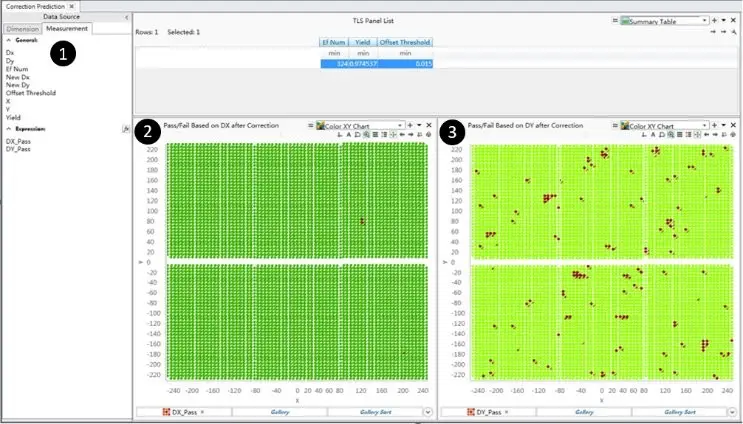
Fig. 1: Yield prediction analysis tools show the selected parameters and overlay error along the X and Y axes. The comparison identifies larger Y-axis errors as a contributor to yield loss.
The prediction method was evaluated with production substrates in an HVM process. Initially, predicted and measured yield differed by 1.2% to 2.7%. Further analysis identified variation in manual inspection judgments as the main source of the gap. After the inspection process was standardized, prediction errors fell to 0.2% to 0.8%. The results show that prediction accuracy depends in part on consistent measurement and inspection.
Qualification can focus on stronger candidates
During development, engineers can simulate multiple process conditions before running qualification substrates. They can use the estimates to select promising operating conditions, then validate those predictions with physical substrates. This approach can cut down trial-and-error iterations and direct qualification effort toward conditions with stronger predicted results.
Residual overlay error maps generated for different process conditions make the comparison visible. They help engineers see how adjustments affect the remaining errors and refine process settings with fewer repeated experiments. The practical gain is more time spent on targeted optimization and less on rerunning conditions that offer little promise.
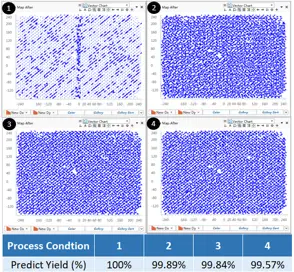
Fig. 2: Residual overlay error vector maps compare process conditions and support process refinement during research and development.
Bring prediction into production monitoring
Yield prediction can also extend from development into mass production. Integrated into the lithography workflow, it can support real-time, in-line monitoring and earlier detection of potential defects. Lithography involves several steps before final inspection determines overlay yield; errors introduced earlier may lead to rework or permanent yield loss.
Checking for emerging problems before final inspection gives teams an opportunity to intervene sooner. Earlier action can reduce the labor, time and cost tied to rework. The workflow diagram below shows yield prediction positioned as part of production monitoring, extending its use beyond process development.
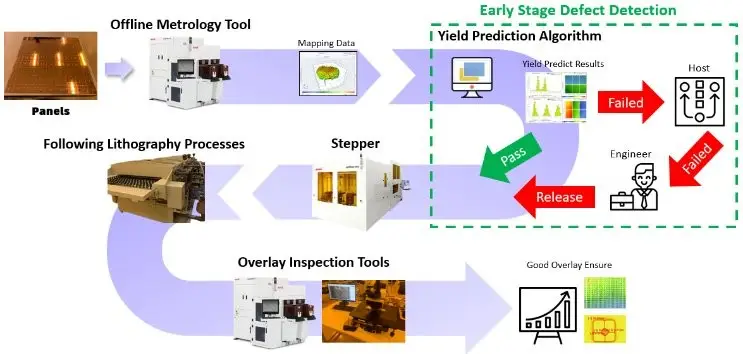
Fig. 3: Yield prediction can support in-line process monitoring and earlier defect detection within the production workflow.
For FOPLP manufacturers, the central tradeoff remains: panel formats can improve substrate utilization, while their spatially varying distortion makes overlay control more demanding. Yield prediction gives process teams a way to compare correction strategies, qualify better candidates and watch for defects earlier in production. Its usefulness will depend on sound metrology and consistent inspection, but it can help shorten the path from process learning to stable, high-yield manufacturing.
 Choosing Single, Double, Welded Flap and Repair Keder for Fabrication
 Houston Engineering Team Builds a Welcoming Golf Tournament at East River 9
 MIG Transfer Modes: Choosing Between Short Circuit, Spray and Pulse